If you are new to crypto trading, candlesticks and their role in technical analysis can feel less intuitive than they do for more traditional markets. This article explains how to read crypto candlestick charts and how common candlestick patterns are used to form trade decisions. You’ll learn:
- What a candlestick chart represents in crypto price action.
- How to recognize named candlestick patterns on a crypto chart.
- How to interpret the main chart contexts (uptrend, downtrend, consolidation) before acting.
- How patterns such as Morning Star, Evening Star, Harami, Piercing Line, Dark Cloud Cover, Three White Soldiers, and Three Black Crows fit into trend and reversal scenarios, including why confirmation matters in volatile crypto markets.
Candlestick Charts in Crypto: Origins and Basics
The candlestick chart format is often traced to 17th-century Japanese rice markets, where traders used stacked “candles” to summarize price movement over a set period. Over time, the same visual idea became widely used in modern charting to help traders interpret whether an asset is likely to move higher or lower.
Candlestick analysis sits within technical analysis, not fundamental analysis. Fundamentals typically focus on company financials, customers, and outlook. For cryptocurrencies, “fundamental” thinking often includes technology and network design, tokenomics, community signals, and adoption indicators such as active wallets, smart contract activity, and usage patterns, alongside broader macro forces that can affect risk sentiment.
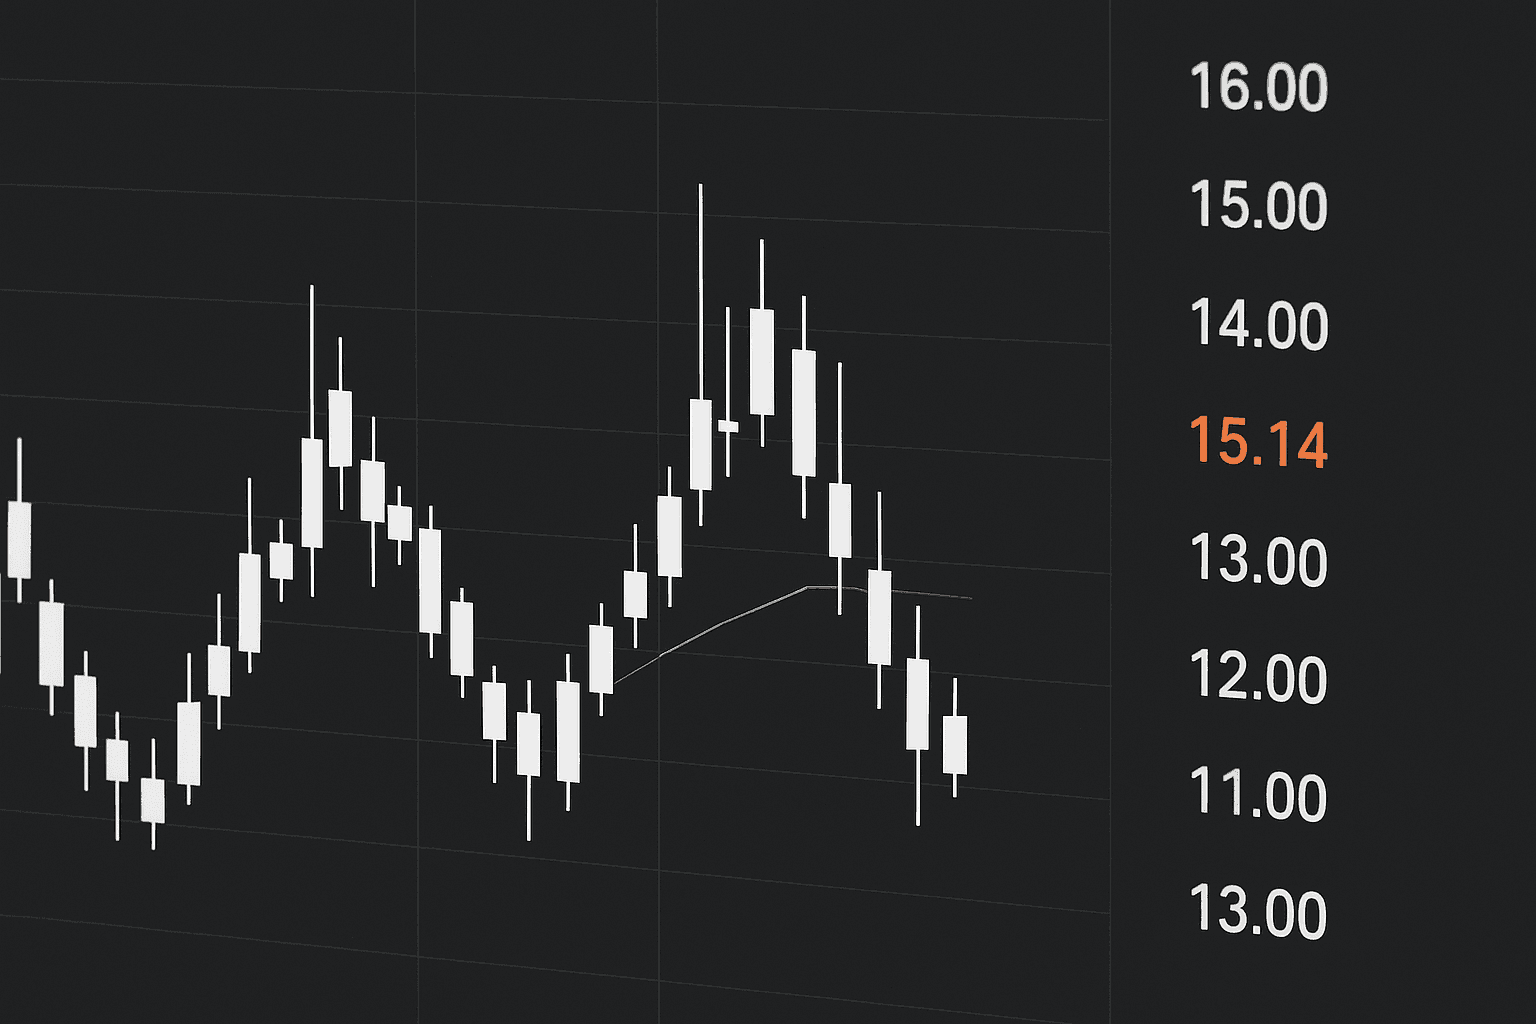
From a practical trading standpoint, candlesticks rely on historical price action to frame potential next moves. Each candle compresses the period’s open, high, low, and close into a single visual: traders can quickly assess direction, intraperiod range, and whether price appears to be continuing the current push or attempting a reversal. Body size, where the close lands within the range, and the length of the wicks can reflect sentiment and the balance of buying vs. selling pressure.
The candle’s body is the main component. It is typically shown in green (close above open) or red (close below open) and represents the opening-to-closing price range for the selected timeframe.
The thin lines above and below the body are wicks, also known as shadows. The upper shadow indicates the session high; the lower shadow indicates the session low.
When the closing price exceeds the opening price, the candle is green and is often labeled bullish because it closes higher than it opens. When the closing price finishes below the opening price, the candle is bearish and is commonly shown in red.
“Bullish” and “bearish” are directional interpretations of sentiment. However, a single candle is rarely enough on its own—multi-candle structure is usually where traders get context about trend strength, indecision, and possible reversals.
How Candlestick Patterns Work in Crypto (Workflow)
- Form: Identify the candle’s OHLC structure (open, high, low, close) and whether it signals trend strength or indecision (for example, a long body vs. long wicks).
- Context check: Confirm whether the pattern appears at meaningful levels such as support/resistance, or within a larger uptrend/downtrend or consolidation range.
- Pattern meaning: Map the pattern to a likely market interpretation (reversal, continuation, or indecision), not just a “bullish/bearish” label.
- Wait for confirmation: Use the next candle(s) to see whether the market follows through—this is especially relevant in crypto’s fast price swings.
- Execution and risk: If you take a trade, align it with broader signals you track (such as moving averages, RSI, and volume) and place risk controls based on the pattern’s structure (often beyond the wick or beyond the pattern’s extreme).
- Review: Because crypto conditions can change quickly, reassess whether confirmation happened and whether liquidity or news-driven volatility may have distorted the signal.
Identifying Candlestick Patterns on Crypto Charts
Sometimes a single candle provides a clear signal. Doji candles—characterized by very small bodies and relatively long shadows—are commonly used to represent indecision. Common variations include:
- Long-Legged Doji: Long upper and lower shadows of similar length, showing heightened uncertainty and a tug-of-war between buyers and sellers.
- Gravestone Doji: A long upper shadow with little to no lower shadow, suggesting higher prices were rejected and bearish pressure entered.
- Dragonfly Doji: A long lower shadow with minimal upper shadow, indicating sellers pushed price down but buyers recovered toward the open.
Beyond single candles, many traders focus on formations created by two or more candles because structure helps distinguish a true shift from routine fluctuation.
To treat a setup as a pattern, evaluate at least two consecutive candles. One confirmation approach is the “three-candle rule,” where traders do not act immediately on the first signal candle. Instead, they wait for follow-through across the next two candles to support the same directional thesis (for example, successive higher closes after a bullish reversal cue, or successive lower closes after a bearish cue).
In crypto trading, this approach is often used to reduce whipsaws in fast markets. For instance, if a bullish reversal candle prints at support on a 1-hour chart, a trader may wait for the next two 1-hour candles to hold above the level and close higher. If the market fails to follow through, the initial candle can be treated as noise rather than a reliable entry trigger.
How to Spot Patterns on Crypto Charts
Crypto trades 24/7, so candlestick sequences are continuous and can reflect overnight liquidity changes, fast participation bursts, and abrupt repricing. A quick scan can reveal broader direction, but disciplined reading of structure improves decision-making for entries, exits, and risk sizing.
Support and resistance are critical zones to anchor your interpretation:
- Support: areas where selling stalls and price tends to bounce.
- Resistance: areas where buying momentum often fades.
For example, levels that were widely watched—such as $20,000 in Bitcoin during September—can eventually break, which illustrates why “support” and “resistance” can fail and then reset as the market reprices.
When support or resistance gives way, it is often prudent to wait for confirmation rather than assume the break will automatically lead to continuation. Breakout or breakdown retests are also useful areas to look for candlestick signals that align with the new structure.
Reading the Main Cryptocurrency Chart Types
Uptrend
An uptrend is typically identified by rising swing highs and swing lows over a sustained period. Red candles may still appear, but the overall structure remains upward, which affects how reversal and continuation signals are interpreted.
Downtrend
A downtrend shows a sequence of lower highs and lower lows, reflecting persistent bearish pressure and a downward bias.
Consolidation Phases
Consolidation occurs when price oscillates within a range and there is no consistent directional edge. Sideways trading can develop inside larger uptrends or downtrends, which means a reversal-looking candle may be less meaningful if the broader range has not resolved.
Calling the end of a trend usually requires more than a few candles. Many traders use tools such as moving averages to verify whether the market is actually transitioning, rather than simply oscillating within the old regime.
Key Factors to Consider
Select a timeframe that matches your plan. Short intervals (such as minutes) can be useful for intraday tactics, but higher timeframes often reduce noise and are easier to interpret when you’re trying to judge swing-level support and resistance.
Context matters. Candles that appear far from meaningful levels tend to be less reliable. Prefer setups where buyers or sellers previously showed clear interest—such as near a prior swing high/low or a well-defined range boundary.
There are also limitations unique to crypto:
- High volatility can overwhelm textbook structures, especially during sharp moves that create long wicks and reverse quickly.
- News and event risk can invalidate patterns without warning, including protocol-related incidents, exchange outages, sudden listings/delistings, or macro headlines that drive one-way flows.
- Low-liquidity conditions can distort candles: thin order books and wider spreads can exaggerate highs and lows and create false “breakouts” that fail to hold.
- Pattern signals are probabilistic and can be subjective. Traders may draw levels differently, read structure differently, or prioritize different timeframes.
- False signals are more common in choppy ranges, where repeated whipsaws produce convincing reversal candles that do not receive follow-through.
Common Candlestick Patterns in Crypto Charts
After you establish the broader bias (trend or range), focus on named candlestick patterns to refine timing and assess whether momentum is actually changing.
Instead of treating patterns as isolated signals, read them alongside confirmation from other inputs already used in this article—such as moving averages, RSI, and volume—and especially in relation to support and resistance.
Common bullish candlestick patterns include Bullish Engulfing setups, Hammer candles, Inverted Hammer candles, Piercing Line, Morning Star, and Three White Soldiers—often interpreted as higher quality when they form after selling pressure and align with support or an improving broader trend.
Common bearish candlestick patterns include Bearish Engulfing setups, Shooting Star candles, Hanging Man candles, Dark Cloud Cover, Evening Star, and Three Black Crows—often watched more closely when they appear into resistance or after an extended advance.
Best / Most Reliable Candlestick Patterns in Crypto (Selection Criteria)
| Pattern | Best use case | Market context | Confirmation needed | Common failure condition |
|---|---|---|---|---|
| Three White Soldiers | Potential bullish reversal after a down move | Near support or after selling pressure exhausts | Follow-through across the three closes (ideally with improving volume) | Appears without meaningful support or gets immediately rejected back into the prior range |
| Three Black Crows | Potential bearish reversal after an up move | Near resistance or after an extended rally | Follow-through across the three closes (often stronger if momentum weakens) | Prints during a choppy range with no structural resistance |
| Morning Star | Reversal sequence from bearish pressure | After a decline, ideally with support alignment | Second candle transition plus a strong bullish third candle close | Third candle fails and price quickly returns below the pattern midpoint |
| Evening Star | Reversal sequence from bullish pressure | After an advance, ideally near resistance | Bearish follow-through on the third candle | Price continues upward despite the sequence (no acceptance) |
| Hammer / Inverted Hammer | Rejection signal after a decline (context-dependent) | Downtrend or post-selloff at a level traders watch | Next candle(s) that validate the move (closes holding above the hammer zone) | Support is not real (low-liquidity wick forms but no acceptance) |
No single candlestick pattern is universally “best.” In crypto, reliability usually improves when a pattern occurs at a level, matches the broader structure, and receives confirmation rather than acting on the first candle alone.
Engulfing Pattern: Bullish and Bearish
The engulfing setup uses two candles. In a bullish engulfing pattern, a green candle’s body fully engulfs the prior red candle’s body, suggesting control is shifting toward buyers. A bearish engulfing is the mirror image: a red candle’s body overtakes the prior green body, implying a potential shift toward sellers.
How traders typically confirm: rather than entering immediately on the first engulf, they look for the second candle to close clearly, then wait for follow-through on the next candle(s). Confirmation is often improved when other signals—such as rising volume, RSI turning in favor of the direction, or a nearby moving average—support the move.
Risk note: if you use engulfing patterns for execution, consider placing a stop-loss beyond the engulfed candle’s extreme (below the bearish pattern’s low for longs, or above the bullish pattern’s high for shorts). Exact placement depends on timeframe and how you define the level.
| Engulfing type | Formation | Prior trend | Signal |
|---|---|---|---|
| Bullish engulfing | Second (green) body fully engulfs the prior (red) body | Often after a down move or bearish pressure | Shift toward buyers; look for acceptance after the close |
| Bearish engulfing | Second (red) body fully engulfs the prior (green) body | Often after an up move or bullish pressure | Shift toward sellers; look for rejection after the close |
Quick example: if ETH trades into a well-watched support level on a 4-hour chart and then prints a bearish candle, a bullish engulfing may appear as the second candle’s body covers the first candle’s body. If the next candle closes higher and holds above the support area, the pattern’s rejection can be treated as more meaningful.
Hammer Pattern
The hammer is commonly viewed as a bullish reversal signal after a decline. It has a small real body near the top of the range and a long lower shadow, often around twice the body length, with little or no upper shadow. The candle can be green or red—what matters most is the long lower rejection that shows buyers absorbing selling pressure.
Confirmation: while some traders use a one-candle interpretation, a more conservative approach is to wait for the next candle(s) to confirm strength—for example, closes that move back above the hammer’s high and hold that level.
Risk note: if you enter based on hammer confirmation, a common stop-loss reference is below the hammer’s low, since the hammer thesis is invalidated if price revisits and breaks that rejection point.
Compact example sequence: after a sustained red move in SOL on the 1-hour chart, price taps a prior swing low and prints a hammer with a long lower shadow. If the next 1-hour candle closes above the hammer’s high and subsequent candles don’t immediately fall back, the hammer is functioning as a reversal signal rather than a temporary bounce.
Shooting Star Pattern
A shooting star appears after an uptrend and features a small body, minimal lower shadow, and a long upper shadow. It highlights rejection at higher prices and is often considered a bearish reversal candidate when later candles confirm the failure to sustain the rally.
Hanging Man Pattern
The hanging man emerges after a visible price rise and resembles a spinning-top style body, with a long lower shadow. It suggests sellers tested control near the top of the advance and may point to a pullback—especially if confirmation follows.
Triangle Patterns
Many traders annotate charts with triangle shapes to map compression zones and likely breakout paths. These formations are useful because they clarify where opposing pressure is building and where a resolution may occur.
There are three primary variants: ascending, descending, and symmetrical triangles.
| Triangle Pattern | Description | Typical Market Signal |
|---|---|---|
| Ascending Triangle | Horizontal resistance with rising swing lows pushing into that ceiling. | Often interpreted as building bullish pressure and a potential upside breakout. |
| Descending Triangle | Horizontal support with progressively lower highs pressing down toward the base. | Often interpreted as building bearish pressure and a potential downside breakdown. |
| Symmetrical Triangle | Converging trendlines as highs fall and lows rise, showing compression and balance. | Typically a neutrality-to-breakout setup that can resolve in either direction. |
Doji-Based Reversal Sequences: Morning Star and Evening Star
When doji candles appear inside multi-candle sequences, they can add nuance. The market often spends time transitioning between selling and buying control, and confirmation is critical because a doji alone is neutral.
Morning Star: a three-candle sequence that typically follows bearish pressure: a bearish candle, then a short-bodied candle (often doji-like) that signals indecision, followed by a bullish candle. Signal: selling momentum is fading and a bullish reversal may be forming. Confirmation: the third candle should show acceptance (a stronger close) and ideally align with support or improved momentum readings.
Evening Star: the opposite structure that typically follows bullish pressure: a bullish candle, then a short-bodied candle (often doji-like) showing indecision, followed by a bearish candle. Signal: buying momentum may be weakening and a bearish reversal could develop. Confirmation: the third candle should close with follow-through, ideally near resistance and with momentum indicators turning down.
Practical note: because crypto can move quickly, doji-based sequences are usually safer when you wait for the third candle’s close and then observe at least one additional candle to confirm the shift.
Perfect Dragonfly Doji and Its Context
A Perfect Dragonfly Doji is a doji-like candle with a very small body near the top of the range and a long lower shadow, implying that sellers drove price down but buyers pushed it back close to the open before the period ended. Signal: it suggests strong rejection of lower prices and potential bullish pressure.
When it matters most: it is more actionable when it occurs at support after a decline or when price reaches a level where rejection has previously occurred. Confirmation: look for a follow-through move on the next candle(s), such as higher closes and acceptance above the pattern area. In low-liquidity conditions, long wicks can be misleading, so volume and spread effects should be considered.
Three White Soldiers and Three Black Crows
| Pattern | Formation | Prior trend | Signal | Confirmation and risk notes |
|---|---|---|---|---|
| Three White Soldiers | Three consecutive bullish candles with successively higher closes (often with relatively small upper shadows) | Often after a downtrend or sustained selling pressure | Buying strength is building and sentiment may be shifting bullish | Confirmation is the third candle’s close and follow-through; consider aligning with rising volume and nearby support. Invalidation often looks like immediate rejection back into the prior range. |
| Three Black Crows | Three consecutive bearish candles with successively lower closes (often with relatively small lower shadows) | Often after an uptrend or sustained buying pressure | Selling pressure is building and sentiment may be shifting bearish | Confirmation is the third candle’s close and continued weakness; consider momentum deterioration (e.g., RSI trend) near resistance. Invalidation often looks like strong bullish reversal after the sequence. |
Concrete crypto example: on a 4-hour BTC chart, if price sells off into a recognized support zone and then prints three consecutive strong green candles (Three White Soldiers), traders typically look for the third candle to close near its highs and for subsequent candles not to immediately break back below the recent swing area. If confirmation fails—especially during abrupt volatility spikes—the pattern can be treated as a short-lived bounce rather than a structural reversal.
Harami and Two-Candle Reversal Meaning
An Harami formation uses two candles and reflects a potential pause or reversal as the second candle’s body becomes smaller and sits within the body of the first candle. In a bullish Harami, a small bullish candle appears after a larger bearish candle, implying selling pressure may be losing control. In a bearish Harami, a small bearish candle appears after a larger bullish candle, implying buying pressure may be weakening.
Confirmation: Harami patterns are often more meaningful when the next candle confirms the direction (for example, a bullish Harami followed by stronger closes) rather than acting immediately on the two-candle structure. Risk note: because Harami can occur within ranges, traders frequently reduce risk by waiting for acceptance through nearby support/resistance.
Piercing Line and Dark Cloud Cover (Two-Candle Reversal)
These two-candle patterns are variations of reversal signals that depend on the second candle’s ability to retrace and change the direction of momentum.
Piercing Line: a bearish candle followed by a bullish candle that opens lower and closes above the midpoint of the prior bearish candle’s body. Signal: bearish momentum is being countered and buyers are taking control. Confirmation: stronger interpretation often comes from follow-through after the second candle’s close, ideally with supportive volume or improving momentum (such as RSI turning upward).
Dark Cloud Cover: a bullish candle followed by a bearish candle that opens above and closes below the midpoint of the prior bullish candle’s body. Signal: buyers are losing control and bearish pressure may be taking over. Confirmation: confirmation can be improved when subsequent candles continue to press lower, ideally near resistance and with weakening momentum.
Risk note: these patterns can fail if the market is in a low-liquidity session or if they appear mid-range without nearby structural levels. Treat them as signals that need confirmation, not guarantees.
Conclusion
Being able to read candlestick charts and recognize key patterns can improve decision-making by sharpening how you define entries, exits, and risk management in crypto markets.
This guide is a starting point rather than an exhaustive reference. Candlestick patterns are best treated as probabilistic signals: traders typically monitor multiple formations, but consistent use requires disciplined context-reading and confirmation.
Candlesticks are useful inputs—especially in crypto where volatility can reveal fast shifts in control. In practice, traders tend to use candle closes as timing cues, place stop-loss levels around the pattern’s extreme (often beyond a wick or swing point), and look for alignment with complementary tools such as moving averages, RSI, and volume. When patterns confirm what trend, momentum, and volume are already suggesting, they are generally more dependable.
Candlestick patterns tend to be most dependable when they confirm what trend, momentum, and volume indicators are already suggesting.