If you are wondering how fundamental analysis applies to crypto, think of it as a research process that estimates an asset’s intrinsic value by studying real-world drivers rather than short-term price moves. For companies, that means digging into financial statements and economic context; for cryptocurrencies and blockchain networks, it also means evaluating utility, adoption, and competitive positioning to judge whether market price sits above or below true worth.
In crypto, the same fundamental mindset applies, but the “financial statements” are often the protocol’s design choices and the network’s observable usage—so the framework has to adapt to what blockchains actually measure and reveal.
In practice, this style of research can help you form conclusions about a crypto asset’s network health, adoption trajectory, sustainability of incentives, and whether its market value seems justified by real usage and long-term utility.
Understanding Fundamental Analysis
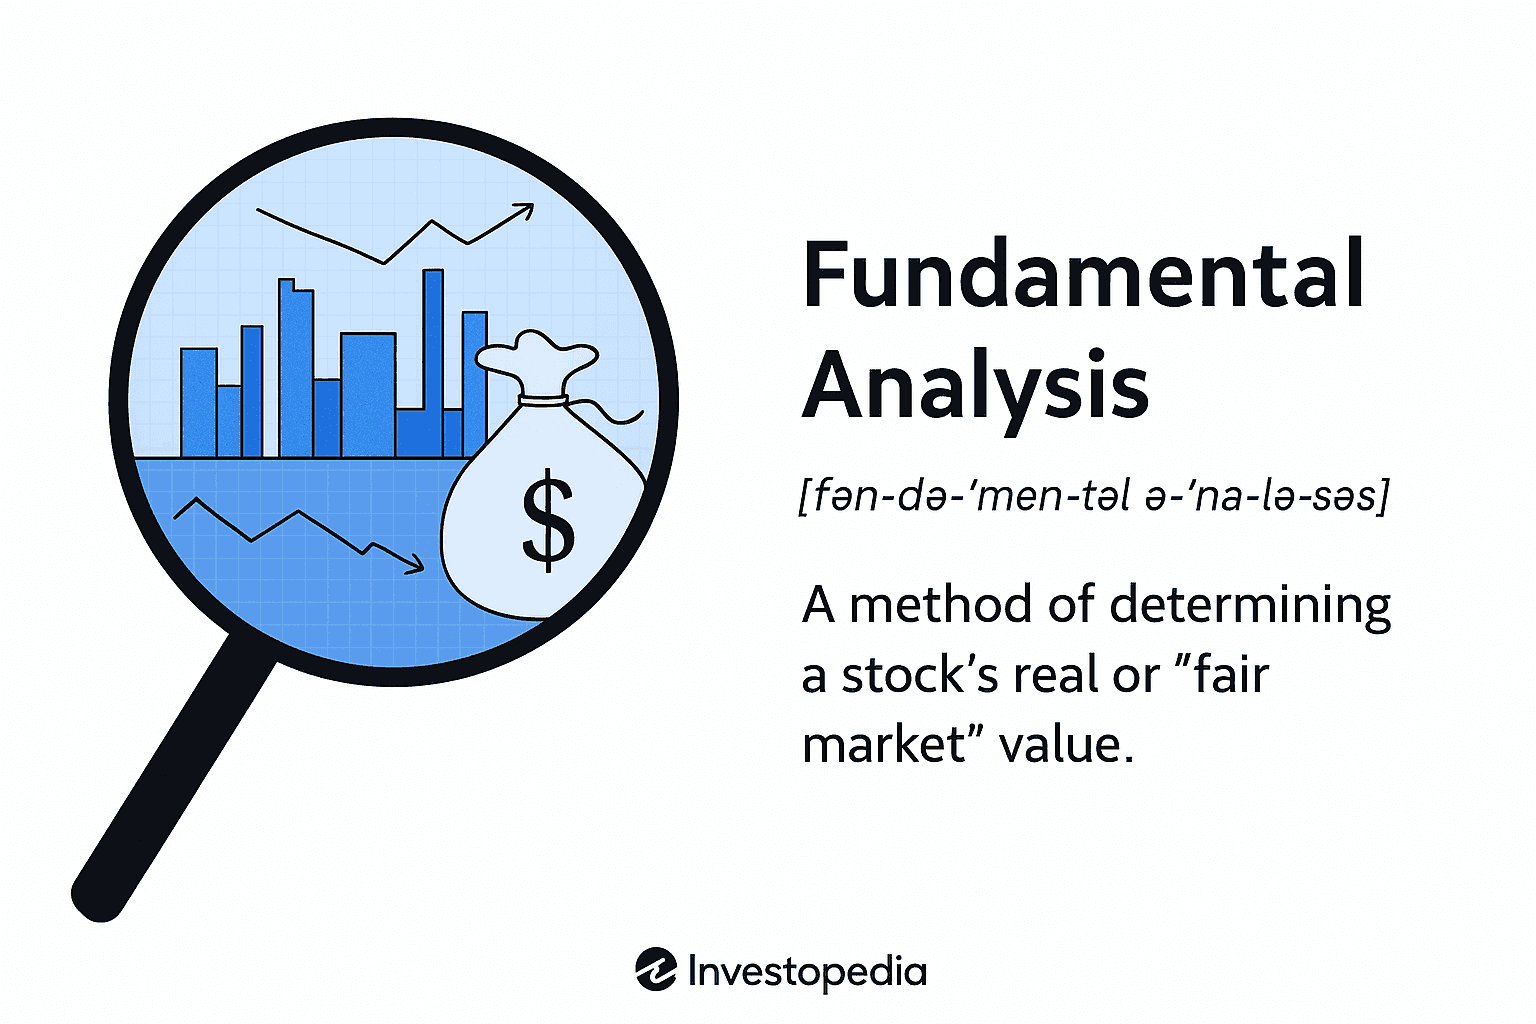
Fundamental analysis centers on the forces that create value, not just where the ticker sits today. By looking past hype cycles and promotional narratives, it helps determine whether a stock or token appears mispriced relative to its economic reality.
The work typically begins with core reports such as the income statement, the balance sheet, and the cash flow statement. Analysts compare assets, liabilities, revenue, margins, and other metrics to peer groups to assess quality and momentum.
It also incorporates external factors that shape outcomes. Growth, inflation, interest rates, sector conditions, and competitive intensity all matter, as do the business model, leadership effectiveness, brand strength, and the potential to scale profitably.
For cryptocurrencies, the inputs look different because there are no standardized earnings reports for a network. Instead, research typically focuses on crypto-specific drivers such as on-chain activity and demand (usage, fees, and user growth), the supply schedule and tokenomics (issuance, distribution, and unlock mechanics), network security (how costly it is to attack and how decentralized participation is), developer activity and upgrade cadence, governance processes, community engagement, regulatory constraints, and the asset’s real utility versus alternatives.
A practical way to run fundamentals on a cryptocurrency such as Bitcoin is to start by defining what the asset is supposed to do (for example, value storage, payments, or settlement) and what would have to be true for that thesis to hold. Next, study the monetary policy and supply schedule to understand scarcity, dilution risk, and how new supply enters the market. Then evaluate network security and decentralization to assess whether the system can reliably keep operating under stress. After that, review usage and adoption signals—ideally separating organic demand from activity driven by incentives. From there, examine liquidity and market structure (depth, spreads, and how derivatives positioning can influence spot moves) to understand how easily price can be pushed around. Finally, incorporate developer and governance dynamics, plus regulatory and custody realities, and translate the full picture into a valuation view that is consistent with your time horizon and risk tolerance.
Why Fundamental Analysis Matters
Focusing on fundamentals helps investors look through daily volatility and concentrate on the operational engines that drive long-run results.
The central benefit is turning qualitative and quantitative inputs into an estimate of value. Financial reports reveal profitability, liquidity, and resilience, while analysis of management, competitive advantage, and industry dynamics supports more objective buy, hold, or sell decisions.
It can also surface bargains. By weighing sales growth, market share, pipelines, and use cases, investors can spot businesses or crypto assets with room to expand earnings and shareholder value—an approach often favored by value-oriented strategies.
Equally, it flags trouble. Studying balance sheets, market position, and execution risks can reveal overvaluation and vulnerabilities—insights that matter most when uncertainty and volatility rise.
In crypto, this lens is especially important because the market is highly volatile, speculation is common, and many assets lack the kind of standardized disclosures investors rely on in equities. Fundamental work helps separate narratives from measurable adoption and credible utility, and it can bring discipline to decisions that might otherwise be driven by momentum alone.
Where to Find a Company’s Fundamentals
Reliable sources for building a fundamentals view include the following:
- Company Filings:Public firms submit periodic reports to the Securities and Exchange Commission, including Form 10-k, Form 10-q, and Form 8-k. These contain audited statements, management discussions, and detailed disclosures, all accessible via the Edgar system.
- Company Website:Investor relations pages host financials, earnings materials, presentations, and transcripts that often address tough analyst questions.
- Financial Platforms:Major portals aggregate news, ratios, market capitalization, analyst estimates, and other data for quick comparisons.
- Broker Research:Brokerage houses publish coverage that combines fundamental analysis with investment opinions.
- Data Providers:Services such as Bloomberg, FactSet, and Morningstar deliver deep datasets and tools typically used by professionals.
- Industry Journals:Trade publications offer context on trends, regulation, competition, and customer behavior.
Use multiple sources to cross-check facts and be mindful of biases or conflicts that could color the analysis.
How to Read an Annual Report
An annual report is a cornerstone document for assessing fundamentals. A practical approach includes:
- Begin With the Chief Executive Officer Letter:Note performance highlights, tone, strategy, and key risks the leader chooses to emphasize.
- Study the Business Overview:Clarify offerings, target customers, competitive edge, and principal threats to the model.
- Review Management’s Discussion and Analysis:Evaluate revenue and expense drivers, cash flows, and the narrative behind the numbers.
- Examine the Statements:Analyze trends across the income statement, balance sheet, and cash flows to compute critical ratios and spot inflections.
- Read the Footnotes:Accounting policies, major transactions, and clarifications often live here.
- Check the Auditor Opinion:Look for qualifications or emphasis-of-matter paragraphs that may signal issues.
- Assess Governance:Board composition, incentives, and oversight should align with shareholder interests.
- Scan Other Disclosures:Legal, regulatory, and environmental, social, and governance topics can materially affect outlook and reputation.
Financial Statements: What They Reveal
Financial statements condense performance into structured reports. Here is what each conveys:
- Income Statement:Shows revenue, expenses, and profit or loss. Trend analysis and margins illuminate growth quality and efficiency.
- Balance Sheet:A snapshot of assets, liabilities, and shareholders’ equity. It helps gauge leverage, liquidity, and solvency.
- Cash Flow Statement:Tracks cash generated and used in operations, investing, and financing. It clarifies the business’s ability to fund obligations and growth.
Because cash is harder to embellish than earnings, many investors treat cash flows as a conservative barometer of performance.
Quantitative and Qualitative Fundamentals
“Fundamentals” span everything affecting economic health—from hard metrics like revenue to softer elements such as leadership quality or brand power. They fall into two broad buckets:
- Quantitative:Evidence expressed as numbers, ratios, or formulas that you can systematically evaluate.
- Qualitative:Attributes such as standards, reputation, and strategic positioning that resist strict measurement.
Robust research blends both: financial statements for the numbers and contextual judgment for the intangibles, including proprietary technology and intellectual property.
Key Qualitative Factors
Analysts routinely weigh these qualitative elements:
- Business Model:Understand exactly how money is made. A chain might sell food, yet profits could come mainly from royalties and franchise fees.
- Competitive Advantage:Durable edges—think Coca-Cola Co.’s brand or Microsoft Corporation’s long-standing operating-system dominance—create a moat that supports growth and returns.
- Management Team:Strategy fails without capable execution. Review leadership backgrounds, track records, and insider trading behavior for alignment.
- Governance and Board Structure:Ethical, transparent, and efficient oversight should protect stakeholder rights and ensure clear communication.
- Industry Structure:Customer base, market share, regulation, and cycles shape opportunity sets and risk.
- Stakeholder Sentiment:Weak satisfaction among employees, customers, suppliers, or investors can erode brand equity and performance.
Key Quantitative Ratios
Companies disclose results that enable ratio analysis. Important categories and formulas include:
- Profitability — Gross Profit Margin:(Revenue minus Cost of Goods Sold) divided by Revenue. Higher margins and returns often reflect stronger execution and efficiency.
- Profitability — Operating Margin:Operating Income divided by Revenue.
- Profitability — Net Margin:Net Income divided by Revenue.
- Profitability — Return on Assets:Net Income divided by Average Total Assets.
- Profitability — Return on Equity:Net Income divided by Average Shareholders’ Equity.
- Liquidity — Current Ratio:Current Assets divided by Current Liabilities. Stronger liquidity suggests near-term obligations can be met without stress.
- Liquidity — Quick Ratio:(Cash + Marketable Securities + Accounts Receivable) divided by Current Liabilities.
- Solvency — Debt-to-Equity Ratio:Total Liabilities divided by Total Shareholders’ Equity. Lower leverage and higher interest coverage generally indicate sturdier balance sheets.
- Solvency — Debt-to-Assets Ratio:Total Liabilities divided by Total Assets.
- Solvency — Interest Coverage:Operating Income divided by Interest Expense.
- Efficiency — Asset Turnover:Revenue divided by Average Total Assets. Higher turnover shows assets are being converted into sales efficiently.
- Efficiency — Inventory Turnover:Cost of Goods Sold divided by Average Inventory.
- Efficiency — Receivables Turnover:Revenue divided by Average Accounts Receivable.
- Valuation — Price–Earnings:Market Price per Share divided by Earnings per Share. Lower valuation metrics can imply undervaluation; higher ones may signal rich pricing.
- Valuation — Price-to-Book:Market Price per Share divided by Book Value per Share.
- Valuation — Price-to-Sales:Market Price per Share divided by Revenue per Share.
- Valuation — Dividend Yield:Annual Dividends per Share divided by Market Price per Share.
Fundamental vs. Technical Analysis
Fundamental research differs from technical analysis, which extrapolates price and volume patterns to anticipate future moves. Chart-based indicators and shapes such as a head-and-shoulders pattern visualize crowd behavior rather than underlying economics.
In crypto, fundamentals often lean on network- and token-level evidence—such as usage trends, fee dynamics, supply mechanics, security posture, and developer momentum—while technical analysis leans on tools like candlestick patterns, moving averages, momentum indicators, and market-structure signals drawn from order books and derivatives data (for example, funding rates and open interest).
The divide comes down to value’s source. Technicians take the market’s price action as primary information. Fundamental investors estimate intrinsic worth and then compare it to the market’s quote.
For cryptocurrency trading, technical tools are often more actionable for short time frames because crypto can move faster than fundamentals can evolve. Fundamental work tends to be most useful for longer-horizon positioning, for avoiding weak projects, and for identifying when a network’s real traction is diverging from its market price. Many traders blend both: fundamentals to define what to own (and why), and technicals to help decide when to enter and exit.
Limits of Fundamental Analysis
Despite its strengths, this approach has constraints to keep in mind:
- Time-Intensive:Gathering data, modeling, and interpreting metrics take effort and expertise.
- Often Lags:Results reflect past periods, and prices may move before the numbers show change.
- Historical Bias:Backward-looking data may miss emerging risks or opportunities.
- Accounting Judgments:Estimates and policy choices can skew reported figures even within generally accepted accounting principles.
- Intangibles Are Tricky:Brand, human capital, and leadership influence outcomes but resist precise valuation.
- Macro Assumptions:Forecasts rely on shifting conditions like rates and inflation that may not play out.
- Short-Term Signals Missed:A long-term lens can overlook tactical trading setups such as momentum bursts.
For crypto specifically, one advantage is that blockchains can be unusually transparent: network activity, supply data, and many protocol rules are visible and auditable in ways that corporate fundamentals often are not. The downside is that “intrinsic value” is harder to pin down when utility is still evolving, incentives can change quickly, and market price can swing far on liquidity shocks, sentiment, and reflexive leverage.
Common mistakes when applying fundamentals to crypto include over-weighting hype and narratives, treating marketing materials as if they were verified disclosures, misunderstanding token supply mechanics (especially dilution and unlocks), confusing raw activity with real demand, ignoring security and smart-contract risk, overlooking governance and upgrade risks, and failing to account for how thin liquidity or leveraged positioning can distort price signals.
Example: Applying Fundamental Analysis
Crypto examples look a bit different from corporate ones. For Bitcoin, a fundamentals-driven view might emphasize whether its security budget appears durable, whether ownership and mining participation remain meaningfully decentralized, and whether adoption is trending in a way that supports its role as a long-term monetary asset. For a smart-contract network, the analysis often centers on whether developers are building, whether users are willing to pay fees for block space, and whether the ecosystem is winning share against competing platforms. For a token with emissions and future unlocks, the work frequently comes down to whether projected supply growth is likely to overwhelm organic demand.
Consider a fictional business, Abc Inc., to illustrate how ratios and context combine to form a view.
Key figures for the prior fiscal year:
| Category | Item | Amount |
|---|---|---|
| Income Statement | Revenue | $1,000 million |
| Income Statement | Cost of Goods Sold | $600 million |
| Income Statement | Gross Profit | $400 million |
| Income Statement | Operating Expenses | $200 million |
| Income Statement | Operating Income | $200 million |
| Income Statement | Net Income | $150 million |
| Balance Sheet | Current Assets | $750 million (Cash $200; Marketable Securities $250; Accounts Receivable $300) |
| Balance Sheet | Noncurrent Assets | $750 million |
| Balance Sheet | Total Assets | $1,500 million |
| Balance Sheet | Current Liabilities | $250 million |
| Balance Sheet | Noncurrent Liabilities | $250 million |
| Balance Sheet | Total Liabilities | $500 million |
| Balance Sheet | Shareholders’ Equity | $1,000 million |
| Cash Flow | From Operations | $250 million |
| Cash Flow | From Investing | $100 million |
| Cash Flow | From Financing | $150 million |
| Stock | Shares Outstanding | 100 million |
| Stock | Price | $25.00 |
Now compute representative ratios:
Profitability Ratios:
- Gross Margin = ($1,000 − $600) ÷ $1,000 = 40%.
- Operating Margin = $200 ÷ $1,000 = 20%.
- Net Margin = $150 ÷ $1,000 = 15%.
- Return on Assets = $150 ÷ $1,500 = 10%.
- Return on Equity = $150 ÷ $1,000 = 15%.
These figures indicate solid profitability and efficient use of capital, with double-digit returns on assets and equity.
Liquidity Ratios:
- Current Ratio = $750 ÷ $250 = 3.00.
- Quick Ratio = ($200 + $250 + $300) ÷ $250 = 3.00.
Ample current and quick liquidity imply near-term obligations are well covered.
Solvency Ratios:
- Debt-to-Equity = $500 ÷ $1,000 = 0.50.
- Debt-to-Assets = $500 ÷ $1,500 = 0.33.
Moderate leverage suggests balance-sheet flexibility and manageable long-term risk.
Valuation Ratios(100 million shares at $25):
- Price–Earnings = $25 ÷ ($150 ÷ 100) = 16.67.
- Price-to-Book = $25 ÷ ($1,000 ÷ 100) = 2.50.
- Price-to-Sales = $25 ÷ ($1,000 ÷ 100) = 2.50.
These multiples sit in a reasonable range versus earnings, book value, and sales.
Beyond the math, assess qualitative context:
Competitive Advantages:
- Recognized brand with loyal customers.
- Proprietary technology differentiating products and services.
- Efficient supply and distribution that lowers costs and shortens delivery times.
Management Quality:
- Experienced leadership with a demonstrated record of execution.
- Long-tenured chief executive officer who has guided multiple growth phases.
- Consistent investment in research and development to drive innovation.
Industry Trends:
- End market expanding at roughly 5% annually.
- Rising demand for sustainable offerings that match the company’s roadmap.
- Increasingly favorable regulatory backdrop.
Growth Prospects:
- Robust product pipeline slated for release over the next 12–18 months.
- Geographic expansion into additional countries planned.
- Recent acquisitions with identifiable synergies and share gains.
Corporate Governance:
- Diverse, independent board with transparent reporting practices.
- Disclosure timeliness and clarity support investor trust.
- Executive pay structures tied to long-term value creation.
Environmental, Social, and Governance Considerations:
- Targets to cut emissions and increase renewable energy usage.
- Commitment to diversity, equity, and inclusion across the workforce.
- Active community engagement and philanthropy.
In this simplified case, Abc Inc. appears financially healthy with credible growth drivers. In real decisions, expand diligence to deeper competitive analysis, management vetting, and scenario testing.
The Bottom Line
Fundamental analysis seeks to estimate what an asset is truly worth and whether the market is pricing it too high or too low by weighing economic conditions, sector context, and financial performance.
Ratios and metrics derived from company reports—and, for cryptocurrencies, from network activity and utility—help investors form independent views. Methods and judgments differ, so aim for a consistent framework that produces clear, actionable conclusions for your strategy.