If you are new to crypto trading, candlesticks and their role within technical analysis can feel unfamiliar compared with other asset classes. This article introduces the foundations of candlestick reading for digital assets. We cover:
- What a candlestick chart represents in crypto.
- Ways to spot a candlestick pattern on a crypto chart.
- How to interpret the main cryptocurrency chart types.
- Frequent candlestick formations seen on crypto charts, including Morning Star, Evening Star, Harami, Piercing Line, Dark Cloud Cover, Three White Soldiers, and Three Black Crows—often considered powerful because they can signal a decisive shift in control between buyers and sellers when they appear at key levels and are confirmed by follow-through price action.
Candlestick Charts in Crypto: Origins and Basics
The candlestick chart format dates back to 17th-century Japanese rice markets, where traders combined multiple candles to anticipate price movement. By the 19th century, this visual approach became a staple for building models that projected whether an asset might rise or fall.
Studying candlesticks is a branch of technical analysis, which contrasts with fundamental analysis. Traditional fundamentals assess a company’s financials, customers, and outlook. For cryptocurrencies, investors look at the underlying technology, tokenomics, community traction, adoption metrics such as wallets, smart contracts and active users, as well as macroeconomic forces that can sway the crypto market.
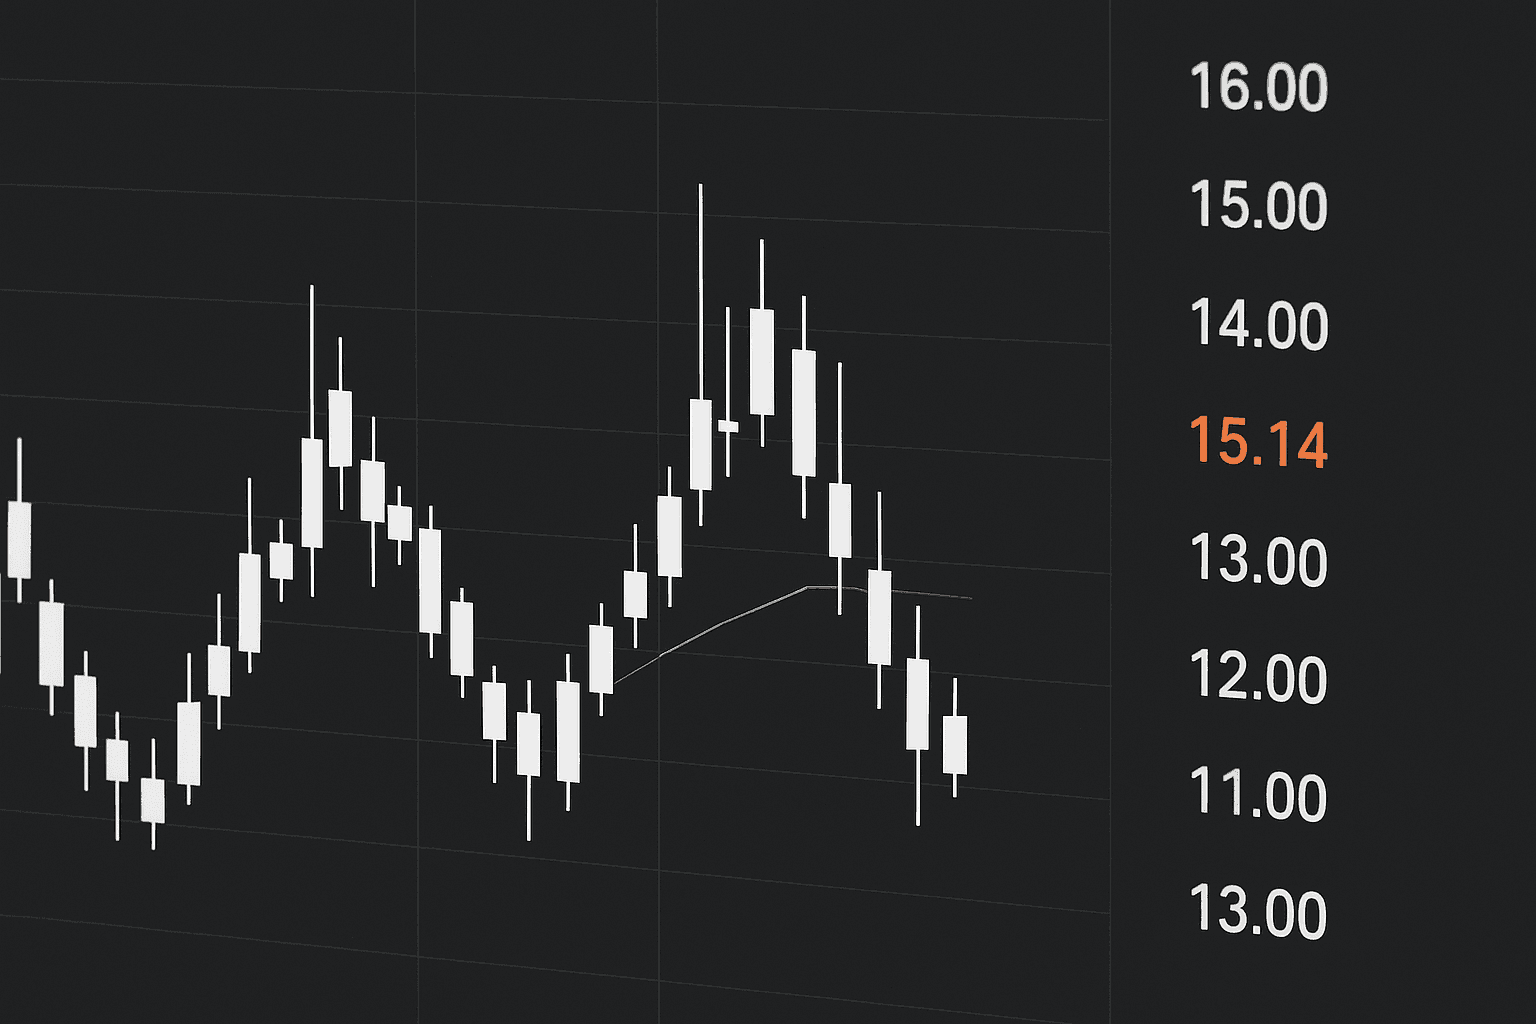
Candlestick trading relies on historical price action to frame potential future moves. A candlestick chart compresses each session’s open, high, low, and closing price into an intuitive visual, helping the trader judge direction and momentum. The size of the body, the position of the close, and the length of the wicks can also hint at market sentiment, the strength of buyers versus sellers, and whether price action looks more like continuation or an early reversal.
The candle’s body is the most prominent element. Typically shown in green or red, it spans the range between the opening and closing prices over the chosen timeframe—effectively mapping the open-to-close move.
Thin lines above and below the body are wicks, also called shadows. The upper shadow marks the session’s high; the lower shadow shows the low.
When the closing price exceeds the opening price, the result is a green candle, often called a bullish candle: the close sits above the open. When the close finishes below the open, the candle is bearish (often red), indicating price decline.
“Bullish” describes optimistic market sentiment, suggesting an uptrend bias. Its opposite, “bearish,” conveys pessimism and downside expectations.
One candle can hint at sentiment, but multi-candle sequences usually provide better context, clarifying trend strength or an impending reversal.
Identifying Candlestick Patterns on Crypto Charts
Sometimes a single candle delivers a clear message. Doji candles, recognized by very small bodies and relatively long shadows, are classic examples of indecision. Common variations include:
- Long-Legged Doji: Long upper and lower shadows of similar length, reflecting heightened uncertainty and a tug-of-war between buyers and sellers.
- Gravestone Doji: A long upper shadow with little to no lower shadow, signaling that higher prices were rejected and bearish pressure emerged.
- Dragonfly Doji: A long lower shadow with minimal upper shadow, hinting that sellers pushed price down but buyers returned it to near the open.
Beyond single candles, patterns arise from combinations of two or more candles, offering clues about trend continuation, a possible reversal, and whether conditions are bullish or bearish.
To classify a setup as a pattern, you must evaluate at least two consecutive candles; seasoned traders often require more context. One common confirmation approach is the 3 candle rule: instead of acting on the first signal candle, traders wait for three consecutive candles to support the same directional thesis (for example, three closes progressing upward after a bullish reversal cue, or three closes weakening after a bearish cue) before committing to an entry.
In crypto trading, the 3 candle rule is often used to reduce whipsaws in fast markets by demanding follow-through. For example, if a bullish reversal candle prints at support on a 1-hour chart, a trader might wait for the next two 1-hour candles to hold above that level and close higher before entering; if that confirmation fails, they may treat the first candle as noise rather than a trade signal.
How to Spot Patterns on Crypto Charts?
Crypto trades 24/7, generating an uninterrupted stream of candlesticks to analyze. You can often gauge the broader direction at a glance, though deeper study can refine entries, exits, and risk.
Support and resistance are critical zones.
- Support: where selling stalls and price bounces.
- Resistance: where buying momentum fades.
For Bitcoin, $20,000 was widely cited as support in September before it was eventually broken, illustrating how these levels can fail and reset.
When support or resistance gives way, it is prudent to wait for confirmation before acting. Breakout or breakdown retests are also prime areas to look for candlestick patterns that validate the new trend.
Reading the Main Cryptocurrency Chart Types
Uptrend
An uptrend features rising swing highs and swing lows over a sustained period. Red candles may appear, but the prevailing direction remains upward, indicating bullish conditions.
Downtrend
A downtrend shows a sequence of lower highs and lower lows, reflecting persistent bearish forces and a downward bias.
Consolidation Phases
Consolidation occurs when price oscillates within a range, offering no clear directional edge. Sideways trading can develop within broader uptrends or downtrends.
Calling the end of a trend typically requires more than raw candles. Many traders incorporate indicators such as moving averages to verify a trend reversal.
Key Factors to Consider
Select a timeframe that aligns with your trading strategy. Short intervals, such as minutes, suit intraday tactics; higher timeframes often provide cleaner signals and reduce noise for longer-term trading strategies.
Context matters. Patterns that appear far from meaningful support or resistance often have lower reliability. Focus on areas where buyers or sellers have previously shown interest.
There are practical limitations to relying on candlestick patterns in crypto trading:
- High volatility can overwhelm textbook setups, particularly during sharp, fast moves that print large wicks and reverse quickly.
- News and event risk can invalidate a pattern without warning, such as protocol exploits, exchange outages, sudden listings or delistings, or macro headlines that trigger one-way flows.
- Low-liquidity markets can create misleading candles, where thin order books and spread widening exaggerate highs and lows and produce false “breakouts” that do not hold.
- Patterns are probabilistic and can be subjective, since different traders may draw levels differently, interpret context differently, or prioritize different timeframes.
- False signals are more common in choppy ranges, where repeated whipsaws can produce convincing-looking reversal candles that fail to follow through.
Common Candlestick Patterns in Crypto Charts
After you establish the broader bias, drill down into candlestick patterns on crypto charts to refine entries and gauge momentum or a potential trend reversal.
Common bullish candlestick patterns include Bullish Engulfing setups, Hammer candles, and Inverted Hammer candles—typically treated as higher quality when they align with a broader uptrend or print near well-defined support.
Common bearish candlestick patterns include Bearish Engulfing setups, Shooting Star candles, and Hanging Man candles—often watched more closely when they appear into resistance after an extended advance.
Engulfing Pattern: Bullish and Bearish
The engulfing setup uses two candles. In a bullish engulfing pattern, a green candle fully engulfs the previous red candle’s body, implying a shift toward buyers. A bearish engulfing is the mirror image, with a red candle overtaking the prior green body, often foreshadowing downside. Traders watch how the second candle closes relative to the first candle to judge conviction and market sentiment.
Hammer Pattern
The hammer displays a small real body near the top of the range with a long lower shadow, often about twice the body’s length, and little to no upper shadow. It can be green or red. Confirmation typically comes when the next candle closes at or above the hammer’s high (the neckline), suggesting buyers absorbed selling pressure. An inverted hammer, which has a long upper shadow, can also precede an uptrend after a decline.
Shooting Star Pattern
A shooting star appears after an uptrend and features a small body, minimal lower shadow, and a long upper shadow. It highlights rejection at higher prices and frequently precedes a bearish reversal if confirmed by subsequent candles.
Hanging Man Pattern
The hanging man emerges after a visible price rise and, like a spinning-top candle, has a small real body. It warns that sellers are testing control at the top of an advance and that a pullback may follow if confirmed.
Triangle Patterns
Many traders annotate charts with triangle shapes to map compression zones and likely breakout paths. These horizontal-style formations enrich technical analysis by clarifying where pressure is building.
There are three primary variants: ascending, descending, and symmetrical triangles.
| Triangle Pattern | Description | Typical Market Signal |
|---|---|---|
| Ascending Triangle | Horizontal resistance with rising swing lows pushing into that ceiling. | Often interpreted as building bullish pressure and a potential upside breakout. |
| Descending Triangle | Horizontal support with progressively lower highs pressing down toward the base. | Often interpreted as building bearish pressure and a potential downside breakdown. |
| Symmetrical Triangle | Converging trendlines as highs fall and lows rise, showing compression and balance. | Typically a neutrality-to-breakout setup that can resolve in either direction. |
Conclusion
Being able to read candlestick charts and recognize patterns can improve decision-making by sharpening entries, exits, and risk management.
This primer opens the door to candlestick analysis, but it is not exhaustive. Traders monitor many formations, and consistent application typically requires experience and discipline.
Candlesticks are powerful inputs—especially in crypto—but they work best alongside complementary tools rather than in isolation. In practice, traders may use candle closes as entry or exit triggers, place stop-losses beyond a wick or recent swing point, and look for trend and momentum alignment using tools such as moving averages, RSI, and volume.
Candlestick patterns tend to be most dependable when they confirm what trend, momentum, and volume indicators are already suggesting.