If you are new to crypto trading, how these visuals work—and how they differ from technical analysis in other markets—may not be obvious. This guide introduces cryptocurrency candlesticks. We cover:
- What a candlestick chart shows in crypto markets.
- How to recognize a candlestick pattern on a crypto chart.
- Ways to interpret these chart types effectively.
- The most common candlestick formations seen in crypto charts.
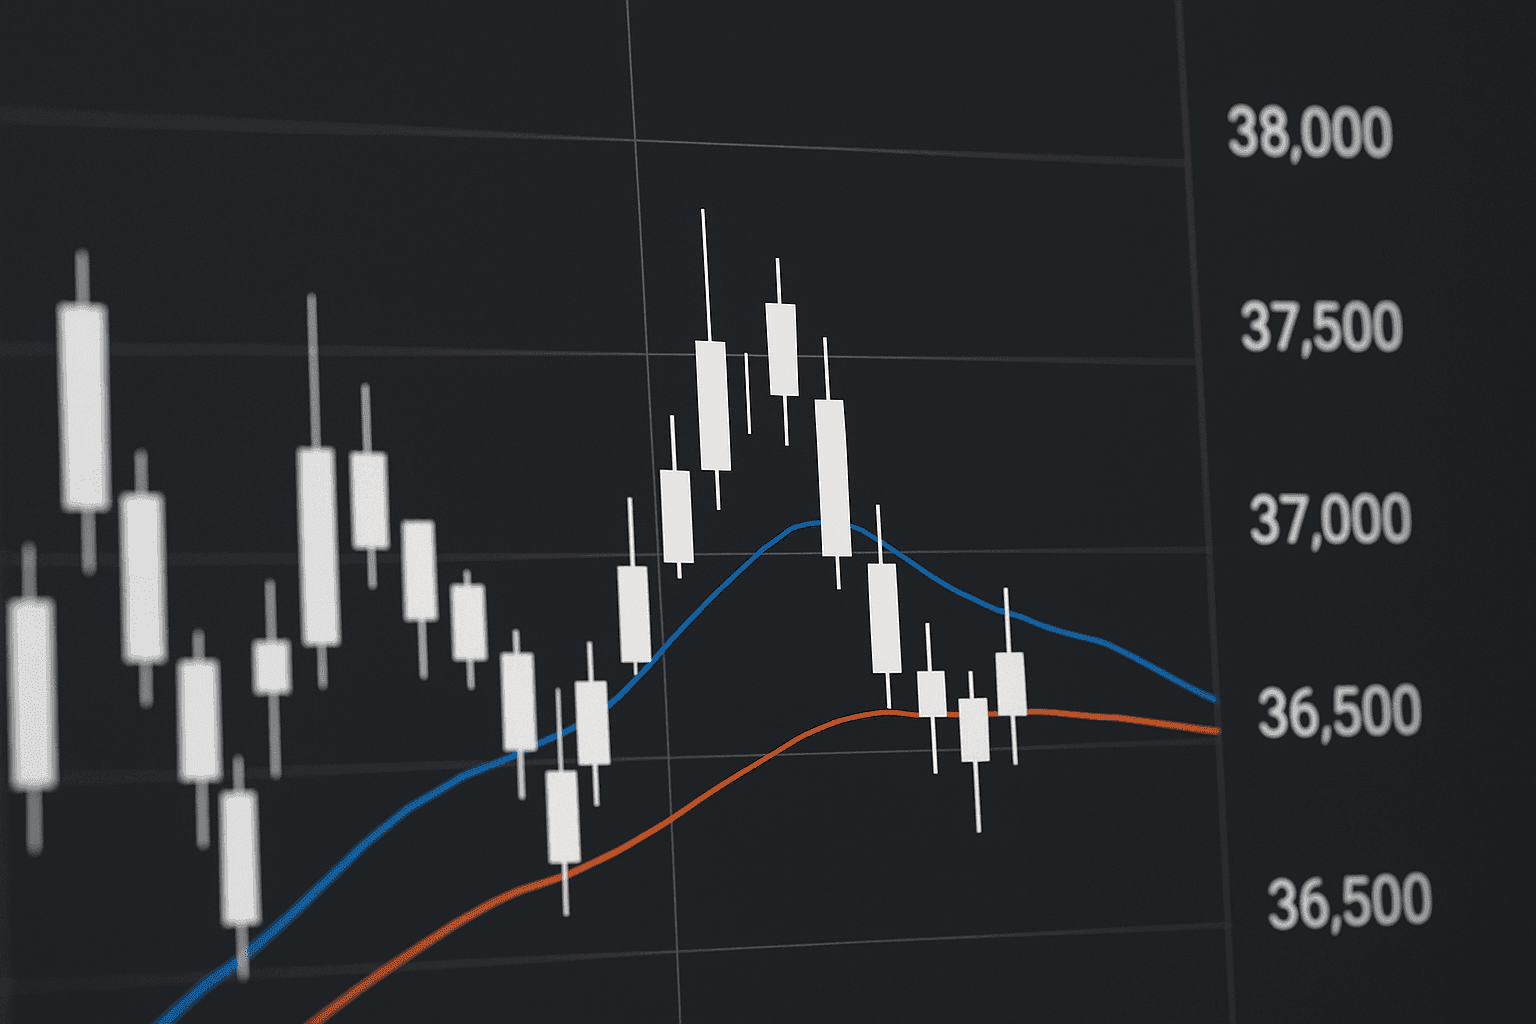
Candlestick Charts in Crypto: What They Show and Why They Matter
These charts trace back to 17th-century Japanese rice markets, where traders combined candles to anticipate price movement. By the 19th century, they had become a staple tool for projecting whether an asset might rise or fall.
Reading candles is part of technical analysis, which contrasts with fundamental analysis. In traditional equities, fundamentals examine revenue, balance sheets, customers, and outlook. For a cryptocurrency, fundamentals might include the underlying technology, tokenomics, community traction, wallet growth, smart contract usage, active users, and more. As with any asset class, macroeconomic conditions can sway digital asset prices.
Candlestick trading takes evidence from prior cycles to infer future price movement. The chart compresses an asset’s trading history into a visual timeline, helping a trader assess context and potential direction.
The candle’s body—the visible rectangle, typically green or red—captures the distance between the opening and closing prices for a selected timeframe. In other words, each candlestick summarizes four core price points: the open, high, low, and close.
Thin lines extending above and below the body are wicks (or shadows). The upper wick marks the session’s high; the lower wick records the low.
When a candle closes above its open, price advanced during that period. Many platforms color these bullish candles green to signal strength at a glance, although some charting setups invert colors (or let you customize them), so it’s worth checking your platform’s convention.
“Bullish” describes optimistic sentiment and an expectation of higher prices; “bearish” indicates the opposite. Red candles are often labeled bearish because they reflect a price drop over the interval.
Although a single candle can be informative, traders usually read sequences of candles to identify trend context before acting.
How to Identify Candlestick Patterns on a Crypto Chart?
Sometimes a lone candle conveys valuable insight. Doji candles are a prime example: they feature very small bodies and long wicks. Common variations include:
- Long-Legged Doji: Upper and lower shadows are similarly long, highlighting indecision and uncertainty in the market.
- Gravestone Doji: A long upper wick with little to no lower shadow, suggesting higher prices were rejected and sellers pushed back.
- Dragonfly Doji: A long lower shadow with minimal upper wick, showing heavy early selling that reversed back to the open by session end.
Beyond single candles, patterns range from basic to advanced. Each formation—made up of multiple candles—offers clues about price direction and whether conditions skew bullish or bearish.
To call something a pattern, you need at least two candles; seasoned traders typically analyze more. More data reduces noise and sharpens the picture.
How to Spot Patterns in Crypto Charts?
Crypto trades 24/7, generating a constant stream of candles. Often, a quick look reveals the dominant trend, though deeper analysis can add precision.
Support and resistance are key zones:
- Support: A level where price declines tend to stall.
- Resistance: A level that caps upward price movement.
One widely cited example is Bitcoin’s 20,000 level in September, which later failed. For broader context, review current market rundowns and recent price structure.
Price often bounces at these areas. When a level breaks, it’s prudent to wait for confirmation before entering a trade. These zones are also ideal places to start scanning for candlestick patterns.
How to Read These Types of Cryptocurrency Charts
Upward Trend
An uptrend features a general climb in price over time—even if red candles appear intermittently. The market is considered bullish as long as the broader path points higher.
Downward Trend
A downtrend shows persistent weakness, with lower highs and lower lows across candles. That structure signals a bearish market.
Consolidation Trends
During consolidation, price oscillates in a range without a clear break in either direction. This sideways action can occur within larger uptrends or downtrends.
Calling the end of a trend usually requires additional confirmation from indicators such as moving averages.
When a candlestick setup aligns with momentum and participation (for example, an oscillator turning and volume expanding), it tends to be more reliable than the candle pattern on its own.
Important Factors to Consider
Choose a timeframe that matches your strategy. Minutes or hourly candles may suit intraday trading, while longer horizons are better for investors. Higher timeframes can filter noise and improve signal quality in technical analysis.
Some traders use a “3-candle rule” as a simple confirmation filter: instead of acting on the first candle that suggests a reversal, breakout, or breakdown, they wait for three subsequent candles (or three closes) to support the same direction. In crypto trading, this is often applied by waiting for follow-through after a pattern appears at a key level—helping reduce whipsaws in a market that can move sharply on thin liquidity.
Patterns that appear at random spots may offer little value. Anchor your reading to support and resistance and then assess any pattern that emerges around those levels.
Candlestick patterns also have limitations. They can generate false signals, they rely heavily on trend and level context, and the same “shape” can mean different things across timeframes. In crypto specifically, volatility, 24/7 trading, and sudden headline-driven moves can invalidate a clean-looking setup quickly—especially if you treat the pattern as predictive rather than as a prompt for confirmation and risk management.
Crypto markets are volatile, and headlines or rumors can override setups. Consider risk controls or hedges to protect against sudden moves.
The Most Common Types of Candlestick Patterns in Crypto Charts
Once you’ve mapped the broader trend, look for specific formations. The following patterns frequently appear and can inform trading strategies.
Many traders consider engulfing patterns among the most powerful because they can show a decisive shift in control within a short window: the second candle fully overtakes the prior candle’s body, which can signal strong follow-through—especially when it appears at a well-watched support or resistance zone.
Common bullish candlestick patterns include:
- Morning Star: A three-candle reversal structure that can suggest selling pressure is fading and buyers are taking control.
- Piercing Line: A two-candle reversal formation where the second candle pushes meaningfully back into the prior candle’s body after a decline.
- Three White Soldiers: A sequence of strong bullish candles that can indicate sustained buying momentum.
Common bearish candlestick patterns include:
- Evening Star: A three-candle reversal structure that can signal buyer exhaustion after an advance.
- Dark Cloud Cover: A two-candle reversal formation where the second candle drops deeply into the prior candle’s body after an up move.
- Three Black Crows: A sequence of strong bearish candles that can indicate sustained selling momentum.
Bullish and Bearish Engulfing
This is a two-candle setup. In a bullish engulfing pattern, a red first candle is fully covered by a larger green second candle, signaling a shift in market sentiment and a potential move higher. A bearish engulfing is the inverse, with a strong red second candle engulfing the previous candle and hinting at downside.
Hammer Candlestick
A hammer displays a small body atop a long lower shadow—often twice the body’s length—with little to no upper shadow. It may be red or green. Confirmation typically comes when the next candle closes at or above the neckline (the top of the hammer’s body). Hammers can mark a trend reversal after intense selling pressure. An inverted hammer, which sports a long upper shadow, can also foreshadow an uptrend.
Shooting Star
Often seen near the peak of an uptrend, a shooting star features a small real body, minimal lower shadow, and a long upper shadow. The long upper wick reflects rejection of higher prices and can precede a bearish reversal.
Hanging Man
Appearing after a recognizable advance, the hanging man can warn of a reversal. It has a small real body and a pronounced lower shadow. Traders sometimes refer to similar small-bodied candles as spinning tops; as always, seek confirmation.
Triangle Patterns
Many traders draw triangle shapes to illustrate horizontal consolidation structures that enrich technical analysis.
There are three main variants: ascending, descending, and symmetrical.
| Pattern Name | Description | Typical Signal |
|---|---|---|
| Ascending Triangle | A breakout-style formation where a flat resistance is tested repeatedly while higher lows compress price from below. | Upside breakout bias |
| Descending Triangle | A bearish-leaning setup formed by a flat support level with lower highs pressing down from above. | Downside breakdown bias |
| Symmetrical Triangle | Converging trendlines built from lower highs and higher lows, showing balance between buyers and sellers before a move in either direction. | Neutral until breakout |
Conclusion
Learning to recognize candlestick patterns and read charts can improve the quality of trading decisions.
Chart skills are a core pillar of market success. This overview is a first step, not a complete catalog. Traders monitor many formations, and consistent execution takes experience and practice.
Candlesticks are powerful, especially in the crypto market, but they work best alongside other tools rather than in isolation. Traders commonly use patterns to time entries and exits, look for confirmation of a broader trend before committing capital, and place stop-loss levels around obvious invalidation points (for example, beyond a recent swing high or low suggested by the pattern).